Mutation

List of causal flows influenced by the mutation.

Causal Flows are statistically significant links between putative causal events (somatic mutations, copy number variations, chromosomal translocations, etc.) and the activity levels of regulators and regulons. In the causal flow, a mutation may causally activate or deactivate a downstream regulator which then might up- down-regulates a regulon that contains genes with similar expression profiles and binding sites.

Causal Mechanistic Flows for Mutation BRAF

RegulatorRoleRegulonCox Hazard Ratio (Regulon)Transcriptional Programs
PRDM1up-regulatesR-20870.00684992Pr-117
ESRRAdown-regulatesR-27470.0501381Pr-35
RORAup-regulatesR-2267-0.0655424Pr-2
PRDM1up-regulatesR-20760.102195Pr-0
ZEB1up-regulatesR-22520.171985Pr-117
ZEB1up-regulatesR-22470.272353Pr-7
MAFGup-regulatesR-1490-0.300169Pr-58
BACH1up-regulatesR-4770.551978Pr-23
HSF2up-regulatesR-31670.645152Pr-3
FOXJ3up-regulatesR-28890.679009Pr-23
JUNup-regulatesR-11860.700789Pr-75
JUNup-regulatesR-1184-0.962738Pr-66

Genes (3)

SHISAL2A, USP7, RUNDC1

Regulons (3)

R-2776, R-1184, R-825

GABPAdown-regulatesR-1456-1.00351Pr-37
SATB1down-regulatesR-10801.00536Pr-130
GABPAdown-regulatesR-1454-1.00665Pr-135
HSF2up-regulatesR-31621.14642Pr-125
FLI1down-regulatesR-7881.22051Pr-7
BACH1up-regulatesR-4711.31822Pr-7
GABPAdown-regulatesR-14551.3231Pr-135
IRF4down-regulatesR-492-1.32725Pr-99
ENSG00000176887up-regulatesR-1891-1.3829Pr-99
DR1up-regulatesR-421.38624Pr-5
FOXJ3up-regulatesR-2892-1.46097Pr-10
MZF1down-regulatesR-30261.49051Pr-97

Genes (5)

THAP5, HMGB1, KPNA5, ATG9A, GLI4

Regulons (5)

R-2187, R-1977, R-1209, R-3026, R-2354

HSF2up-regulatesR-31651.4989Pr-7
MAFGup-regulatesR-14891.63202Pr-117
RORAup-regulatesR-22651.67679Pr-5
ZEB1up-regulatesR-22491.69836Pr-1
PAX6down-regulatesR-1552-1.72081Pr-98

Genes (2)

QTRT1

Regulons (3)

R-65, R-1552, R-1565

ATF2up-regulatesR-30931.86649Pr-139
PAX6down-regulatesR-15571.87661Pr-71
ATF4up-regulatesR-942.11724Pr-8
ZNF219up-regulatesR-22122.14665Pr-139
ZNF219up-regulatesR-22192.18386Pr-132

Genes (3)

CHRM4, MAP3K3, BCKDHA

Regulons (7)

R-44, R-1378, R-2219, R-1352, R-898, R-2756, R-197

MZF1down-regulatesR-30212.2875Pr-87
PAX6down-regulatesR-1559-2.4187Pr-37
DBPdown-regulatesR-29542.60221Pr-83

Genes (1)

APOBEC3D

Regulons (4)

R-2101, R-2954, R-1662, R-2556

BACH1up-regulatesR-4762.9321Pr-21
FLI1down-regulatesR-787-3.00169Pr-118
MAFGup-regulatesR-14943.01778Pr-21
ENSG00000175832up-regulatesR-312-3.06Pr-36
HSF2up-regulatesR-31603.09147Pr-8
FLI1down-regulatesR-780-3.11957Pr-36
TEFdown-regulatesR-2406-3.30554Pr-135
ZNF219up-regulatesR-22103.3532Pr-8
VDRdown-regulatesR-1229-3.57357Pr-115

Genes (0)

Regulons (7)

R-2348, R-1201, R-962, R-1413, R-1229, R-2655, R-566

CEBPBup-regulatesR-1775-3.79192Pr-36
FLI1down-regulatesR-794-4.49758Pr-36
ESRRAdown-regulatesR-2740-4.64571Pr-36
ZNF219up-regulatesR-2215-4.80967Pr-104
BACH1up-regulatesR-474-4.99214Pr-39
FOXJ3up-regulatesR-28757.15409Pr-71

Mutation Causal Mechanistic Flow Network

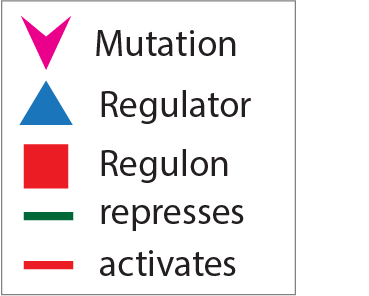
Cytoscape network of the causal flows influenced by the mutation.

Influences from mutations (magenta chevrons) to regulators (blue triangles) and then from regulators to the given regulon (red square) are indicated with colored edges. Red-colored edges denote up-regulation or activation while green colored edges represent down-regulation or repression.

Mutation Survival Plots

Kaplan-Meier curves demonstrating the sub-stratification of clinical subtypes based upon the network activity of the most predictive individual or pair of genes as determined by the LASSO predictions