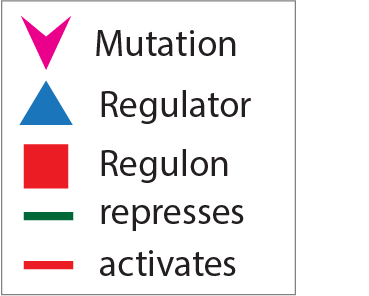
| BORCS8-MEF2B | up-regulates | R-959 | -0.721458 | Pr-58 Genes (28)ZNF135, PLEKHM3, FAM220A, C3orf38, GAS1, SIAH2, GPR132, PDE4B, CDK10, PCYT2, ARHGAP30, SMIM29, FPR3, ZFP69B, C3orf62, NUGGC, FAM53B, IL1RAP, MPHOSPH8, ZNF781, NCOR2, LAMA2, ERI2, HIST1H3J, WWP2, STKLD1, MIF Regulons (28)R-386, R-1756, R-1490, R-817, R-1516, R-1342, R-2943, R-2529, R-959, R-2510, R-1213, R-578, R-641, R-2353, R-2974, R-2982, R-2054, R-833, R-2190, R-657, R-964, R-67, R-2871, R-2195, R-3076, R-2521, R-1894, R-3148 |
| DBP | down-regulates | R-2953 | 0.918338 | Pr-125 Genes (16)RPS6KA3, GBA, HMGN4, CMTM4, TEAD1, BCAM, NIF3L1, MKL1, CR1, RING1, PVRIG, GET4, LOC102724159, PI4KA, SMIM20 Regulons (17)R-589, R-1538, R-54, R-2559, R-2953, R-223, R-1504, R-1914, R-3162, R-2359, R-1975, R-2741, R-2547, R-892, R-482, R-2476, R-1703 |
| FLI1 | down-regulates | R-789 | -1.43137 | Pr-19 Genes (8)COL4A6, HSD17B8, CPT1B, PPM1N, LYN Regulons (11)R-51, R-392, R-789, R-2483, R-2, R-2551, R-501, R-1967, R-1674, R-2202, R-1064 |
| ESRRA | down-regulates | R-2741 | 1.72748 | Pr-125 Genes (16)RPS6KA3, GBA, HMGN4, CMTM4, TEAD1, BCAM, NIF3L1, MKL1, CR1, RING1, PVRIG, GET4, LOC102724159, PI4KA, SMIM20 Regulons (17)R-589, R-1538, R-54, R-2559, R-2953, R-223, R-1504, R-1914, R-3162, R-2359, R-1975, R-2741, R-2547, R-892, R-482, R-2476, R-1703 |
| SRF | down-regulates | R-1788 | -1.83514 | Pr-118 Genes (18)ZNF169, CCDC121, LCORL, CUEDC1, ZBTB44, MIER1, ECI2, C4orf47, ZNF611, ERV3-1, HIGD1C, TOMM6, CSKMT, SMIM1, POU5F2, DPP3, EBLN2 Regulons (25)R-388, R-1185, R-2333, R-841, R-967, R-2625, R-125, R-1390, R-2192, R-1859, R-2750, R-1922, R-1788, R-842, R-1521, R-2694, R-131, R-1957, R-694, R-787, R-2413, R-2213, R-2689, R-1379, R-3146 |
| PLAG1 | down-regulates | R-1525 | -2.09931 | Pr-42 Genes (6)IRAK4, KLRK1, ANG, FNIP1, CD302, RAB44 Regulons (11)R-2041, R-155, R-2539, R-1503, R-1525, R-2628, R-2766, R-509, R-2700, R-2735, R-1381 |
| RUNX2 | up-regulates | R-1283 | 2.3191 | Pr-123 Genes (5)ADGRG1, FADS3, ZC3H11A, RTEL1 Regulons (19)R-943, R-2260, R-514, R-1283, R-1375, R-1547, R-1031, R-1339, R-1706, R-185, R-23, R-2106, R-2367, R-1056, R-616, R-2650, R-1443, R-35, R-220 |
| SRF | down-regulates | R-1786 | 2.43898 | Pr-117 Genes (51)LRRC25, MRPL48, CNTD1, EFCAB5, ZDHHC13, PPFIA3, TBL1XR1, IL17RA, POLR2L, KLHL28, SHARPIN, PHLDA2, IST1, SKA2, JRKL, TRMT12, WDR27, ADSSL1, SHC4, YTHDF3, ZNF267, OR2AG2, PTAR1, SLX4, PRPF40A, RABL6, ANXA4, WDR5B, MAFG, TOPORS, KCNMB2, MFAP3L, PHACTR4, TRIQK, SUPT4H1, LTC4S, DDX47, FIS1, CKLF, FAM185A, RARB, IRF4, HOXA3 Regulons (53)R-2087, R-1556, R-2707, R-342, R-2610, R-2252, R-62, R-1904, R-1388, R-1266, R-2882, R-369, R-451, R-1677, R-1495, R-1591, R-771, R-2371, R-2535, R-1846, R-945, R-500, R-986, R-2995, R-2886, R-630, R-2738, R-2991, R-1735, R-1032, R-643, R-2069, R-1485, R-2179, R-2961, R-157, R-2336, R-2142, R-2358, R-1271, R-1489, R-1734, R-2090, R-1742, R-2070, R-3168, R-2704, R-994, R-2335, R-1786, R-539, R-2068, R-1929 |
| BORCS8-MEF2B | up-regulates | R-963 | 2.55553 | Pr-82 |
| ENSG00000176887 | up-regulates | R-1898 | -2.61611 | Pr-36 Genes (1)LTB4R Regulons (25)R-56, R-1510, R-329, R-1898, R-1507, R-766, R-2752, R-340, R-1779, R-312, R-780, R-965, R-1752, R-124, R-679, R-1775, R-626, R-794, R-168, R-2740, R-1567, R-518, R-2111, R-2277, R-2545 |
| BRCA1 | up-regulates | R-1031 | 2.71498 | Pr-123 Genes (5)ADGRG1, FADS3, ZC3H11A, RTEL1 Regulons (19)R-943, R-2260, R-514, R-1283, R-1375, R-1547, R-1031, R-1339, R-1706, R-185, R-23, R-2106, R-2367, R-1056, R-616, R-2650, R-1443, R-35, R-220 |
| ENSG00000105991 | down-regulates | R-229 | -2.84707 | Pr-45 |
| ENSG00000175832 | up-regulates | R-313 | -2.85877 | Pr-101 Genes (5)ZSCAN30, EFCAB7, ARPC4-TTLL3, HOXA5, BDP1 Regulons (14)R-1496, R-1909, R-840, R-292, R-2138, R-3196, R-1505, R-3182, R-313, R-330, R-1903, R-2161, R-2368, R-2292 |
| SRF | down-regulates | R-1779 | -3.05603 | Pr-36 Genes (1)LTB4R Regulons (25)R-56, R-1510, R-329, R-1898, R-1507, R-766, R-2752, R-340, R-1779, R-312, R-780, R-965, R-1752, R-124, R-679, R-1775, R-626, R-794, R-168, R-2740, R-1567, R-518, R-2111, R-2277, R-2545 |
| ENSG00000175832 | up-regulates | R-312 | -3.06 | Pr-36 Genes (1)LTB4R Regulons (25)R-56, R-1510, R-329, R-1898, R-1507, R-766, R-2752, R-340, R-1779, R-312, R-780, R-965, R-1752, R-124, R-679, R-1775, R-626, R-794, R-168, R-2740, R-1567, R-518, R-2111, R-2277, R-2545 |
| FLI1 | down-regulates | R-780 | -3.11957 | Pr-36 Genes (1)LTB4R Regulons (25)R-56, R-1510, R-329, R-1898, R-1507, R-766, R-2752, R-340, R-1779, R-312, R-780, R-965, R-1752, R-124, R-679, R-1775, R-626, R-794, R-168, R-2740, R-1567, R-518, R-2111, R-2277, R-2545 |
| ESRRA | down-regulates | R-2745 | -3.32726 | Pr-43 |
| IRF4 | down-regulates | R-493 | -3.47489 | Pr-35 Genes (10)ZBTB7A, TMEM107, BHLHA15, GLTPD2, ZNF395, MAFB, SMIM13, AKAP2, FOX3A Regulons (20)R-2747, R-3059, R-336, R-2624, R-1948, R-14, R-277, R-2826, R-1570, R-1094, R-1244, R-2621, R-1232, R-1506, R-3019, R-493, R-1945, R-2691, R-1963, R-2244 |
| ENSG00000176887 | up-regulates | R-1897 | -3.60963 | Pr-47 |
| PLAG1 | down-regulates | R-1527 | 3.7556 | Pr-54 |
| ESRRA | down-regulates | R-2740 | -4.64571 | Pr-36 Genes (1)LTB4R Regulons (25)R-56, R-1510, R-329, R-1898, R-1507, R-766, R-2752, R-340, R-1779, R-312, R-780, R-965, R-1752, R-124, R-679, R-1775, R-626, R-794, R-168, R-2740, R-1567, R-518, R-2111, R-2277, R-2545 |
| SRF | down-regulates | R-1787 | -5.29074 | Pr-104 Genes (3)ZNF518B, POLR2M, MIA Regulons (12)R-374, R-1474, R-1081, R-2519, R-2496, R-3191, R-828, R-2215, R-1138, R-1787, R-621, R-2720 |
| FLI1 | down-regulates | R-783 | 6.1459 | Pr-69 |
| SRF | down-regulates | R-1780 | 7.20867 | Pr-71 Genes (2)MAGED1, RNASEK Regulons (11)R-2115, R-1557, R-2261, R-152, R-3122, R-2875, R-1780, R-1426, R-2048, R-1071, R-1628 |


