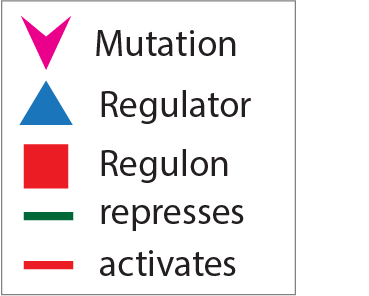
Cytoscape network of causal flows connected to this regulon. Influences from mutations (green diamonds) to regulators (blue triangles) and then from regulators to the given regulon (red square) are indicated with colored edges. Red-colored edges denote up-regulation or activation while green colored edges represent down-regulation or repression.
Causal Mechanistic Flow Network

Regulon Summary
Regulons are regulatory units consisting of a coherently expressed set of genes and the associated regulator(s) whose binding site(s) they share. Regulon summary table displays all associated information related to the specific regulon including the number of genes in the regulon, Hazard ratio, its Regulator, the Transcriptional Program that includes the regulon, Drugs that are associated with members of the regulon, together with mechanism of action and class, and enriched hallmarks of cancer if any.
Causal Flows
Causal Flows are statistically significant links between putative causal events (somatic mutations, copy number variations, chromosomal translocations, etc.) and the activity levels of regulators and regulons. In the causal flow a mutation may causally activates or deactivates a downstream regulator which then might up- or down-regulates a regulon that contains genes with similar expression profiles and binding sites.
Regulon Genes
List of genes that are included in the regulon. These genes have similar expression profiles in subset of patients and they share common binding motif for the Regulator of the regulon. Clicking on the gene name will take you to the gene specific page with more details. Please wait while information is collated from several resources after you click.


